BEV模型常用性能评价指标总结
混淆矩阵
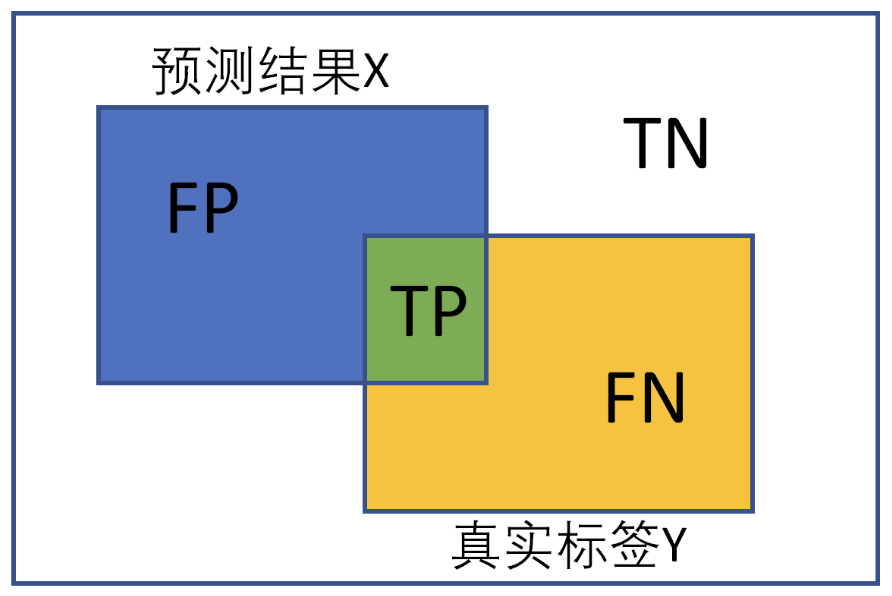
混淆矩阵(confusion matrix)是一种特定的矩阵用来呈现算法性能的可视化效果,其每一列代表预测值,每一行代表的是实际的类别。这个名字来源于它可以非常容易的表明多个类别是否有混淆(也就是一个class被预测成另一个class)。下面是二分类的混淆矩阵: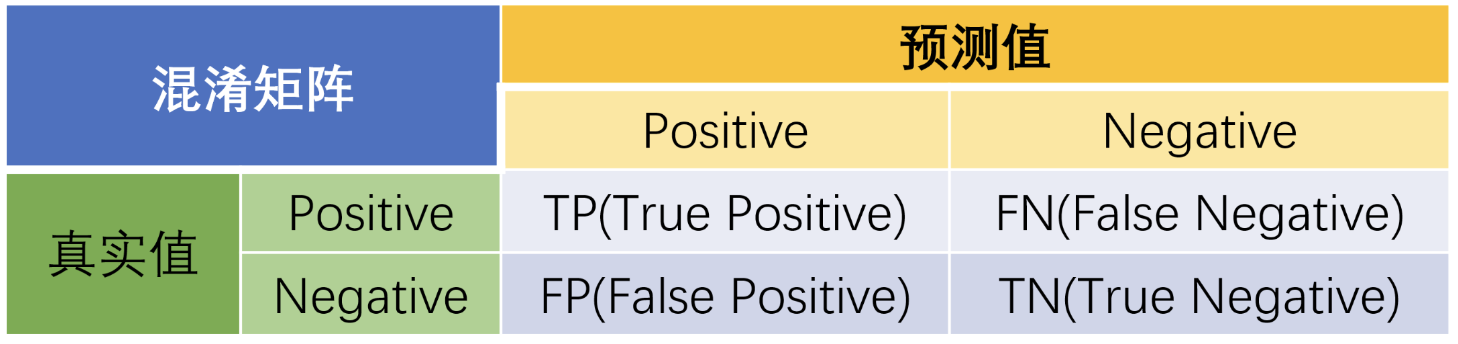
预测值与真实值相同为True,反之则为False。混淆矩阵的对角线是判断正确的,期望TP和TN越大越好,FN和FP越小越好。
查准率 Precision
表示模型预测为正例的所有样本中,预测正确(真实标签为正)样本的占比:
查全率 Recall
表示所有真实标签为正的样本,有多大百分比被预测出来:
F1-score
表示precision和recall的调和平均数,具体公式如下:
语义分割
语义分割的本质任务是分类任务,常规分类任务的对象是图像中的物体,而语义分割的对象是图像中像素点。
IoU
IoU计算实现
def iou(input, target, classes=1):
    """  compute the value of iou
    :param input:  2d array, int, prediction
    :param target: 2d array, int, ground truth
    :param classes: int, the number of class
    :return:
        iou: float, the value of iou
    """
    intersection = np.logical_and(target == classes, input == classes)
    # print(intersection.any())
    union = np.logical_or(target == classes, input == classes)
    iou = np.sum(intersection) / np.sum(union)
    return iou
2D目标检测
IoU
2D检测框的IoU实现
x1,y1,x2,y2 = box1 #box1的左上角坐标、右下角坐标
x3,y3,x4,y4 = box2 #box1的左上角坐标、右下角坐标

#计算交集的坐标
x_inter1 = max(x1,x3) #union的左上角x
y_inter1 = max(y1,y3) #union的左上角y
x_inter2 = min(x2,x4) #union的右下角x
y_inter2 = min(y2,y4) #union的右下角y

# 计算交集部分面积,因为图像是像素点,所以计算图像的长度需要加一
# 比如有两个像素点(0,0)、(1,0),那么图像的长度是1-0+1=2,而不是1-0=1
interArea = max(0,x_inter2-x_inter1+1)*max(0,y_inter2-y_inter1+1)

# 分别计算两个box的面积
area_box1 = (x2-x1+1)*(y2-y1+1)
area_box2 = (x4-x3+1)*(y4-y3+1)

#计算IOU,交集比并集,并集面积=两个矩形框面积和-交集面积
iou = interArea/(area_box1+area_box2-interArea)
GIoU (Generalized Intersection over Union)
GIoU相较于IoU多了一个‘Generalized’,这也意味着它能在更广义的层面上计算IoU,并解决两个图像没有相交时,无法比较两个图像的距离远近的问题,公式定义如下
其中C代表两个图像的最小包庇面积,也可以理解为这两个图像的最小外接矩形的面积。
原有IoU取值区间为[0,1],而GIoU的取值区间为[-1,1];在两个图像完全重叠时,IoU=GIoU=1,在两个图像距离无限远时,IoU=0而GIoU=-1
# 分别是第一个矩形左右上下的坐标
x1,y1,x2,y2 = box1 #box1的左上角坐标、右下角坐标
x3,y3,x4,y4 = box2 #box1的左上角坐标、右下角坐标
iou = Iou(box1,box2)
area_C = (max(x1,x2,x3,x4)-min(x1,x2,x3,x4))*(max(y1,y2,y3,y4)-min(y1,y2,y3,y4))
area_1 = (x2-x1)*(y1-y2)
area_2 = (x4-x3)*(y3-y4)
sum_area = area_1 + area_2

# 第一个矩形的宽
w1 = x2 - x1

# 第二个矩形的宽
w2 = x4 - x3
h1 = y1 - y2
h2 = y3 - y4
# 交叉部分的宽
W = min(x1,x2,x3,x4)+w1+w2-max(x1,x2,x3,x4)
# 交叉部分的高
H = min(y1,y2,y3,y4)+h1+h2-max(y1,y2,y3,y4)
# 交叉的面积
Area = W*H
# 两矩形并集的面积
add_area = sum_area - Area

# 闭包区域中不属于两个框的区域占闭包区域的比重
end_area = (area_C - add_area)/area_C
giou = iou - end_area
AP & mAP
PR曲线: Precision-Recall曲线
AP: PR曲线下面积解
mAP: mean Average Precision, 即各类别AP的平均值
在混淆矩阵的部分,我们已经介绍过TP、FP等定义。在计算AP的过程中,我们首先需要确定如何判断推理结果属于哪个类别。
以单张图像为例,首先遍历图片中ground truth对象,然后提取我们要计算的某类别的gt objects,之后读取我们通过检测器检测出的这种类别的检测框(其他类别的先不管),接着过滤掉置信度分数低于置信度阈值的框(也有的未设置信度阈值),将剩下的检测框按置信度分数从高到低排序,最先判断置信度分数最高的检测框与gt bbox的iou是否大于iou阈值,若iou大于设定的iou阈值即判断为TP,将此gt_bbox标记为已检测(后续的同一个GT的多余检测框都视为FP,这就是为什么先要按照置信度分数从高到低排序,置信度分数最高的检测框最先去与iou阈值比较,若大于iou阈值,视为TP,后续的同一个gt对象的检测框都视为FP),iou小于阈值的,直接规划到FP中去。代码实现如下
if ovmax > ovthresh:             # 若iou大于阈值
  if not R['difficult'][jmax]:   # 且要检测的gt对象非difficult类型
    if not R['det'][jmax]:       # 且gt对象暂未被检测
      tp[d] = 1.                 # 此检测框记为TP
      R['det'][jmax] = 1         # 并将此gt对象标记为已检测
    else:                        # 若gt对象已被检测,那么此检测框为FP
      fp[d] = 1.
else:                            # iou<=阈值,此检测框为FP
  fp[d] = 1.
关于图片中FN的统计就比较简单了,图片中某类别一共有多少个gt我们是知道的,减去TP的个数,剩下的就是FN的个数了。
现在我们已经能够计算得到某一类别的percision和recall。PR曲线与x轴所围成的面积,即为当前类别的AP值。AP值计算有3种方式:
- 在VOC2010以前,只需要选取当Recall >= 0, 0.1, 0.2, …, 1共11个点时的Precision最大值,然后AP就是这11个Precision的平均值。
- 在VOC2010及以后,需要针对每一个不同的Recall值(包括0和1),选取其大于等于这些Recall值时的Precision最大值,然后计算PR曲线下面积作为AP值。
- 设定多个IOU阈值(0.5-0.95,0.05为步长),在每一个IOU阈值下都有某一类别的AP值,然后求不同IOU阈值下的AP平均,就是所求的最终的某类别的AP值。
3D目标检测(以nuScenes为例)
NDS
Our final score is a weighted sum of mean Average Precision (mAP) and several True Positive (TP) metrics.
nuScenes detection score (NDS): We consolidate the above metrics by computing a weighted sum: mAP, mATE, mASE, mAOE, mAVE and mAAE. As a first step we convert the TP errors to TP scores as TP_score = max(1 - TP_error, 0.0). We then assign a weight of 5 to mAP and 1 to each of the 5 TP scores and calculate the normalized sum.
mAP
We use the well-known Average Precision metric, but define a match by considering the 2D center distance on the ground plane rather than intersection over union based affinities. Specifically, we match predictions with the ground truth objects that have the smallest center-distance up to a certain threshold. For a given match threshold we calculate average precision (AP) by integrating the recall vs precision curve for recalls and precisions > 0.1. We finally average over match thresholds of {0.5, 1, 2, 4} meters and compute the mean across classes.
AP的阈值匹配不使用IoU来计算,而使用在地平面上的2D中心距离d来计算。解耦了物体的尺寸和方向对AP计算的影响。nuScenes的mAP计算设置的阈值为$\{0.5, 1, 2, 4\}$米。
several True Positive (TP) metrics
Here we define metrics for a set of true positives (TP) that measure translation / scale / orientation / velocity and attribute errors. All TP metrics are calculated using a threshold of 2m center distance during matching, and they are all designed to be positive scalars.
- Average Translation Error (ATE): Euclidean center distance in 2D in meters.
- Average Scale Error (ASE): Calculated as 1 - IOU after aligning centers and orientation.
- Average Orientation Error (AOE): Smallest yaw angle difference between prediction and ground-truth in radians. Orientation error is evaluated at 360 degree for all classes except barriers where it is only evaluated at 180 degrees. Orientation errors for cones are ignored.
- Average Velocity Error (AVE): Absolute velocity error in m/s. Velocity error for barriers and cones are ignored.
- Average Attribute Error (AAE): Calculated as 1 - acc, where acc is the attribute classification accuracy. Attribute error for barriers and cones are ignored.
补充
NMS实现
对于一张图片中的每一个预测框来说,模型为其每一个类别都预测了一个置信度分数(一般多分类,模型输出后接softmax,每一个类别都得到了一个置信度分数,包括背景类)我们取置信度最高的那一个类别作为预测框中对象所属的类别。
- 首先我们将置信度分数低于置信度阈值a的所有预测框去掉 。
- 然后在同一张图片上,我们按照类别(除开背景类,因为背景类不需要进行NMS),将所有预测框按照置信度从高到低排序,将置信度最高的框作为我们要保留的此类别的第1个预测框,
- 然后按照顺序计算剩下其他预测框与其的IoU,
- 去掉与其IoU大于IoU阈值b的预测框(其实代码实现里是将这些要去掉的预测框其置信度分数置为0),
- 第一次迭代结束,我们已经剔除了与第一个框重合度较高的框。
NMS手写实现
import numpy as np
def nms(dets, thresh):
    """Pure Python NMS baseline."""
    x1 = dets[:, 0]
    y1 = dets[:, 1]
    x2 = dets[:, 2]
    y2 = dets[:, 3]
    scores = dets[:, 4]
    areas = (x2 - x1 + 1) * (y2 - y1 + 1)
    order = scores.argsort()[::-1]  # 置信度从高到低排序
    keep = []
    while order.size > 0:
        i = order[0]    # 此类别中置信度最高的预测框的索引
        keep.append(i)  # 将其作为保留下来的第1个预测框
        xx1 = np.maximum(x1[i], x1[order[1:]])
        yy1 = np.maximum(y1[i], y1[order[1:]])
        xx2 = np.minimum(x2[i], x2[order[1:]])
        yy2 = np.minimum(y2[i], y2[order[1:]])
        w = np.maximum(0.0, xx2 - xx1 + 1)
        h = np.maximum(0.0, yy2 - yy1 + 1)
        inter = w * h
        ovr = inter / (areas[i] + areas[order[1:]] - inter) # 计算其余预测框与置信度最高的预测框的IoU
        inds = np.where(ovr <= thresh)[0]  # 记录下第1个与其Iou<阈值的预测框,也就是与其Iou<阈值的预测框中置信度最高的
        order = order[inds + 1]     # 将与保留下来的第1个预测框Iou<阈值的预测框中置信度分数最高的预测框作为第2个要保留的
    return keep  # 所有经过NMS后保留下来的框
参考
https://www.cnblogs.com/Fish0403/p/17117778.html
https://zhuanlan.zhihu.com/p/75348108
https://zhuanlan.zhihu.com/p/70306015
https://zhuanlan.zhihu.com/p/64423753